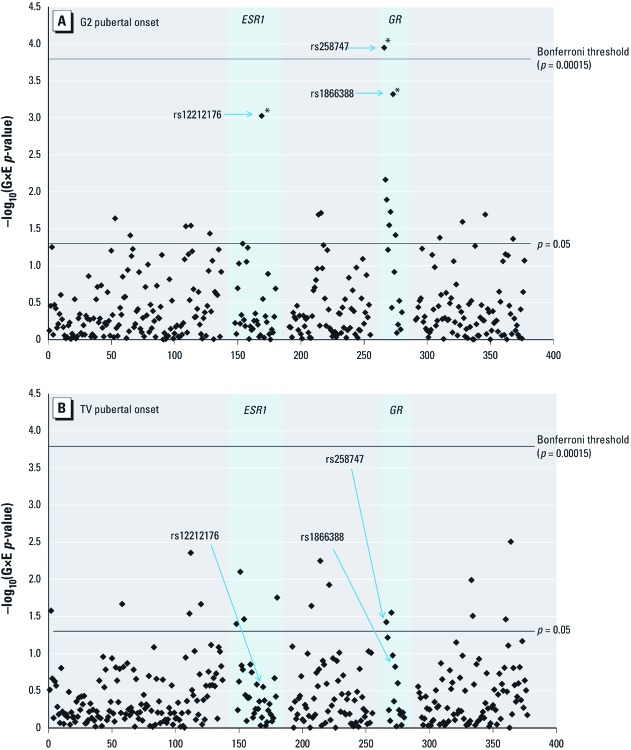
Figure 1.
Manhattan plots: statistical strength of association (–log10 p-value) for the gene–dioxin interaction terms of all 337 SNPs (x-axes), for both G2 (A) and TV (B) pubertal onset. Statistical strength of interaction (–log10 p-value) is plotted against genomic position within the 46 genes and 2 intergenic regions. The number of SNPs with gene–environment (G×E) p-value < 0.05 was 19 for G2 and 18 for TV, with 17 expected by chance for each outcome. The two highlighted genes (ESR1 and GR) are those containing SNPs with G×E FDR q < 0.2 for either G2 or TV. The Bonferroni threshold is calculated as 0.05/337 = 0.00015. *SNPs with G×E FDR q < 0.2.

