Figure 3.

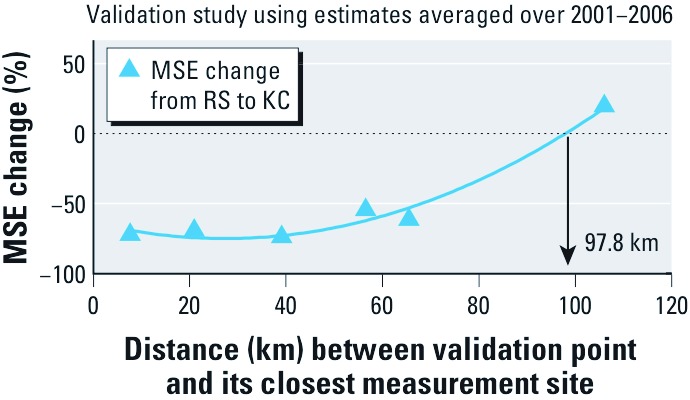
Percent change in MSE from RS to KC shown as a function of the distance between the validation point and its closest measurement site. The curve indicates a second order polynomial regression model that fits the MSE changes.

Percent change in MSE from RS to KC shown as a function of the distance between the validation point and its closest measurement site. The curve indicates a second order polynomial regression model that fits the MSE changes.