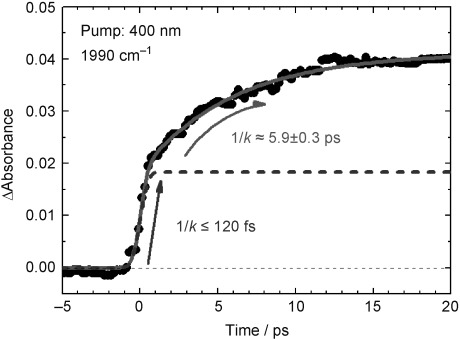
Figure 10.

Time profile of the absorbance changes for a solution of 1 a in THF following excitation with a 400 nm laser pulse. The monitoring wavenumber is 1990 cm−1. The solid line is a curve calculated from a single-exponential and step function convoluted with a laser function.
