Figure 5.

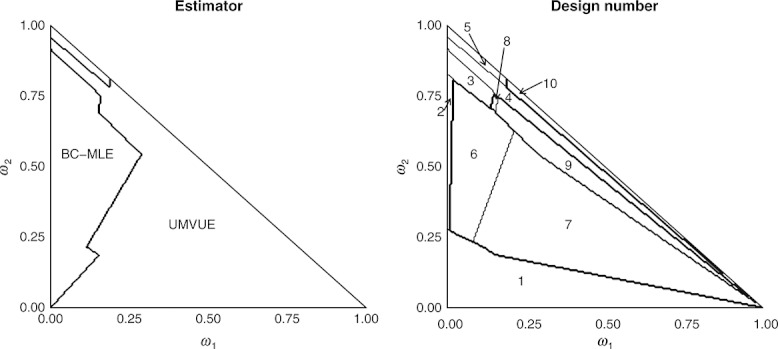
Left: The values of ω1 and ω2 supported by the two chosen estimators. Right: The values of ω1 versus ω2 as a function of the 10 distinct admissible design and analysis pairings (for a Shuster-type trial).

Left: The values of ω1 and ω2 supported by the two chosen estimators. Right: The values of ω1 versus ω2 as a function of the 10 distinct admissible design and analysis pairings (for a Shuster-type trial).