
Fig. 3.
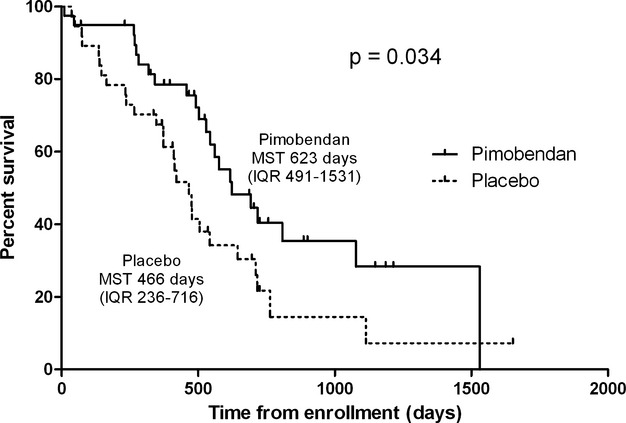
Kaplan Meier survival curves for the all-cause mortality analysis, plotting the estimated percentage of surviving dogs in each group, against time. MST, median survival time; IQR, interquartile range.
Official websites use .gov
A
.gov website belongs to an official
government organization in the United States.
Secure .gov websites use HTTPS
A lock (
) or https:// means you've safely
connected to the .gov website. Share sensitive
information only on official, secure websites.
Kaplan Meier survival curves for the all-cause mortality analysis, plotting the estimated percentage of surviving dogs in each group, against time. MST, median survival time; IQR, interquartile range.