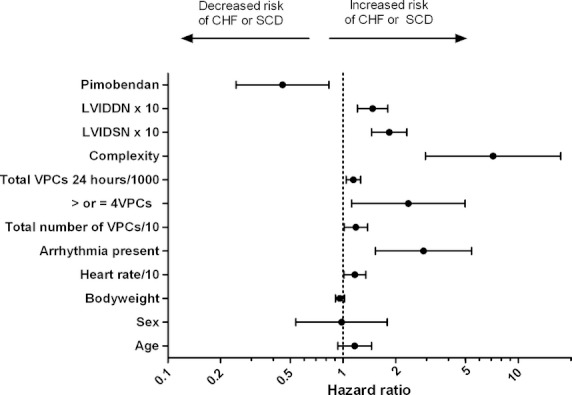
Fig. 4.

A forest plot showing the hazard ratio and 95% confidence intervals associated with variables considered in the univariable analyses with time to the primary endpoint (congestive heart failure or sudden death) as the dependent variable. Circles represent the hazard ratio and the horizontal bars extend from the lower limit to the upper limit of the 95% confidence interval of the estimate of the hazard ratio. CHF, congestive heart failure; SCD, sudden cardiac death; LVIDDN, normalized left ventricular internal diameter in diastole; LVIDSN, normalized left ventricular internal diameter in systole; VPCs, ventricular premature complexes; /10 indicates that the hazard ratio is for a 10-unit change in the variable of interest; /1000 indicates that the hazard ratio is for a 1000-unit change in the variable of interest; ×10 indicates that the hazard ratio is for a 0.1-unit change in the variable of interest.
