
Fig. 5.
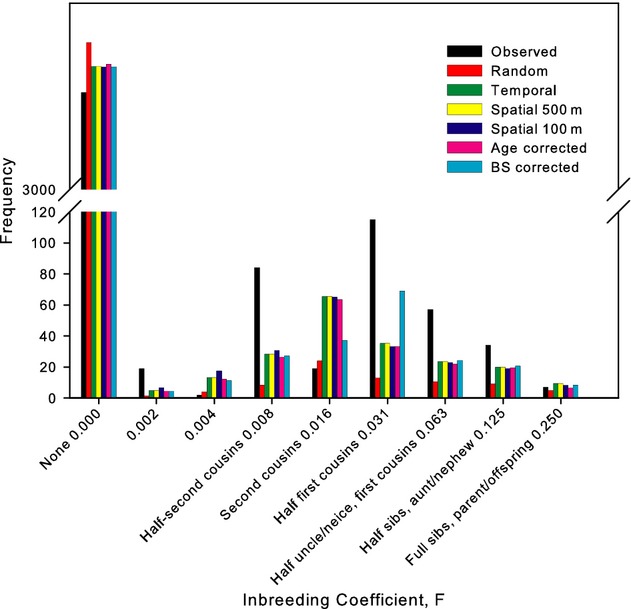
Inbreeding coefficients. Comparison of inbreeding coefficients in the observed pedigree, and the average for each simulated pedigree. Inbreeding coefficients are binned into groups representing key inbreeding events; however, it should be noted that many inbreeding coefficients were intermediate values, due to the effects of intralineage polygyny (e.g. see Fig. 6).