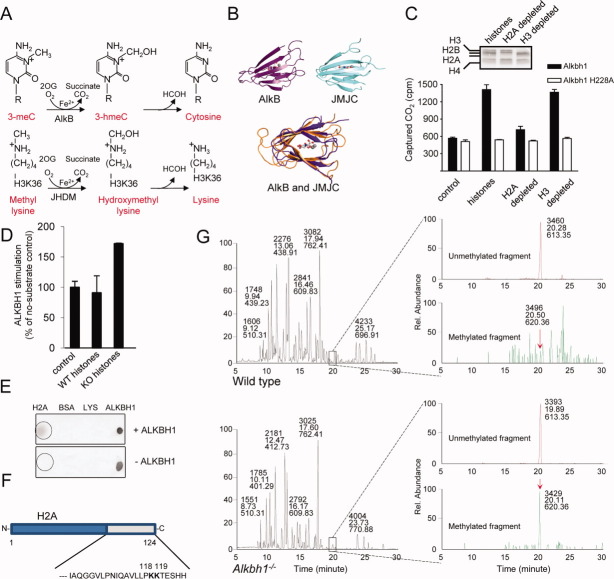
Figure 6.
Histone H2A from Alkbh1−/− mouse embryonic fibroblast (MEF) cells contains a methylation group not present in wild-type (WT) histones. (A): Analogous hydroxylation mechanisms for demethylation of 3-methyladenine by the AlkB repair enzyme (top panel) and the hydroxylation of monomethyl lysine by a JmjC domain-containing histone demethylase, resulting in a similar loss of one methyl group and the generation of unmodified lysine (bottom panel). (B): The Fe(II)-2OG dioxygenase cores of E. coli AlkB (upper left) and the JmjC domain of human JMJD2A (upper right), shown in the same orientation. This shows the common “jellyroll” structural fold of the AlkB and JmjC-domain superfamilies. (C): Dioxygenase activity was evaluated by the CO2-capture assay using purified ALKBH1 with either purified HeLa core histones or core histones that were immunodepleted of H2A or H3. The ALKBH1 H228A variant is an inactive protein harboring a mutation in the Fe(II)-binding domain. Data are presented as the mean of two replicates. Error bars represent one SD. We used Coomassie-stained SDS-PAGE to analyze HeLa core histones immunodepleted for histones H2A and H3. (D): Histones purified from WT and Alkbh1−/− mESC show that Alkbh1−/− histones stimulate ALKBH1 activity approximately 80% more efficiently than WT histones. (E): Dot blot showing the physical interaction between the ALKBH1 and H2A proteins in vitro. (F): Representation of histone H2A, highlighting the C-terminal sequence harboring the region targeted by ALKBH1. (G): Analysis of histone H2A purified from WT or Alkbh1−/− MEFs using mass spectrometry. The maintenance of modifications after purification is shown in Supporting Information Figure S3A. Chromatograms on the left represent signals obtained from the entire run. Chromatograms on the right represent signals found for the peptide indicated in (E). The signal for the unmethylated peptides (upper chromatograms of the WT or Alkbh1−/−, respectively) is 6.68 × 10⁵ for WT MEFs and 4.30 × 10⁵ for Alkbh1−/− MEFs. The lower chromatograms represent the same peptide with the addition of 28.0314 Da (the mass of a dimethyl group or two monomethyl groups). The methylated peptide was undetectable in the WT sample, whereas there was a signal of 1.87 × 10⁴ for the Alkbh1−/− sample. The x-axis represents the elution time and the y-axis indicates the relative abundances of the peptides. Abbreviation: ALKBH1, AlkB homolog 1.

