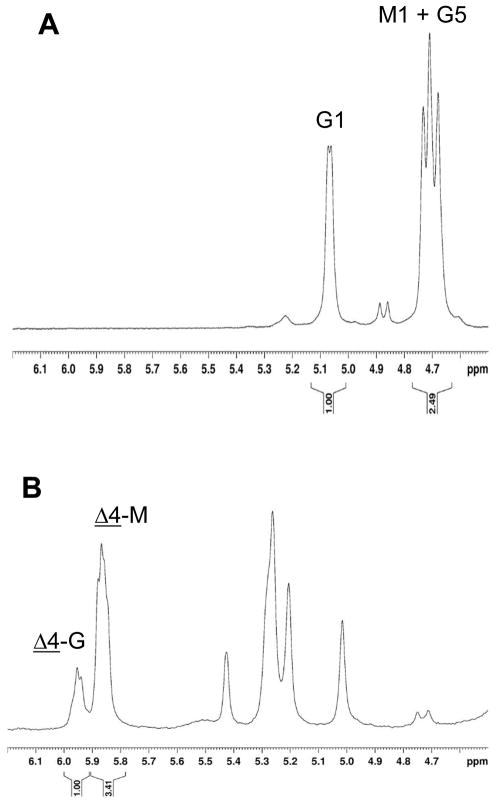
Figure 3.
1H NMR spectra of PDO486 alginate before (A) and after (B) digestion with AlgL. G and M refer to guluronate and mannuronate, respectively; the number is the proton from which the signal arises. Δ-G and Δ-M refer to unsaturated residues at the nonreducing end of the products adjacent to guluronate and mannuronate, respectively. The area under each labeled peak is given below the chemical shift axis.

