Figure 2.
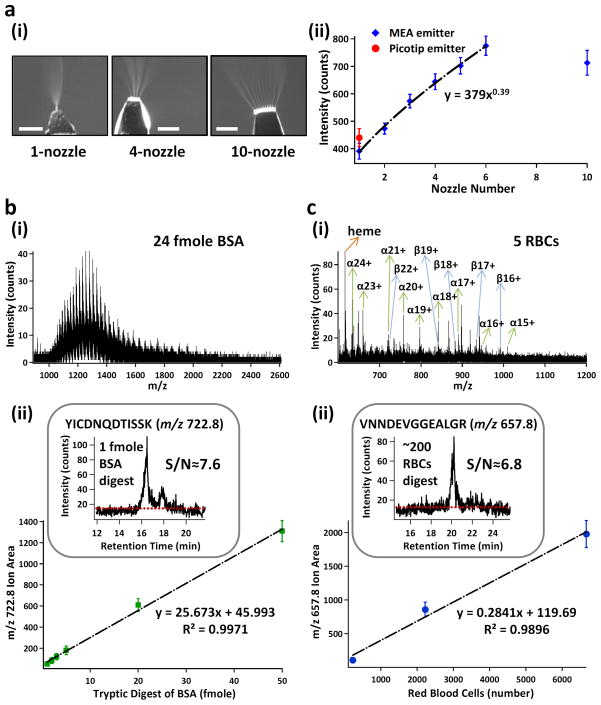
Proof-of-principle applications of the 24-pex MEA chip. (a) Dependence of ESI-MS sensitivity on the nozzle number of MEA emitters. (a–i) Representative images for electrospray of 1-, 4-, and 10-nozzle emitters, Scale bars are 500μm; and (a–ii) Sensitivity dependence on the nozzle numbers of MEA emitters (blue). A Picotip emitter was used as a comparison (red). MS sensitivity of MEA emitters using GFP (100 fmole/μL) illustrates a power-law relation to spraying nozzle numbers (1–6) with a power constant of 0.39. 10-nozzle ones were excluded from the curve fitting. (b) Representative mass spectrum of 24 fmole BSA (b–i) and calibration curve for quantifying tryptic digests of BSA (b–ii). Mass spectra were acquired by direct infusion of full-length BSA in 50/50 acetonitrile/H2O+0.1% formic acid. The correlation curve between the peak areas for a selected ion and the amount of BSA digests was obtained by LC-MS/MS analysis of BSA digests. The insert shows the extracted ion chromatogram of a selected tryptic peptide ion (m/z 722.8, YICDNQDTISSK) from 1 fmole BSA digest. The signal-to-noise ratio (S/N) was calculated to be ~ 7.6. (c) Representative mass spectrum of hemoglobin from ~5 RBC lysate (c–i) and calibration curve for quantifying tryptic digests of RBC lysate (c–ii). Mass spectra were acquired by direct infusion of RBC lysate in 50/50 acetonitrile/H2O+0.1% formic acid. The ions of the heme group, and multiply-charged α- and β-subunits of hemoglobin are designated. The correlation curve between the peak areas for a selected ion and the number of RBCs was obtained by LC-MS/MS analysis of trypsin digests of RBC lysate. The insert shows the extracted ion chromatogram of a selected tryptic peptide ion (m/z 657.8, VNNDEVGGEALGR) from the digest of ~200 RBC lysate. The signal-to-noise ratio (S/N) was calculated to be ~ 6.8. Error bars, s.d. (n≥6).

