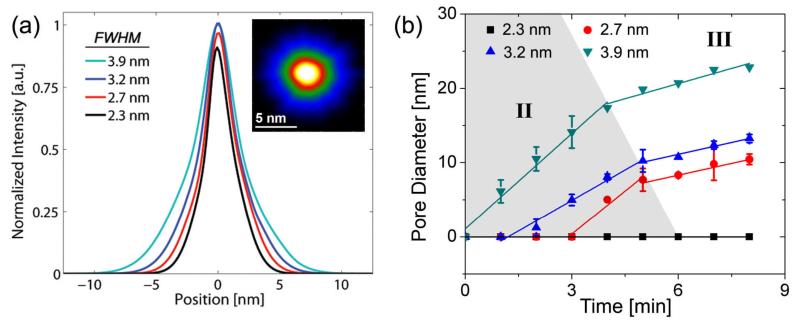
Figure 2.
(a) Intensity profiles of the focused electron probes used during nanopore formation constructed from TEM images. Intensity is normalized with respect to peak intensity of the 3.9 nm FWHM probe (Inset) TEM image of a 3.2 nm probe showing spatial intensity distribution (b) Nanopore sputtering kinetics illustrating pore diameter vs. time for the various probes examined. Distinct expansion rates were observed delineating the three stages of pore formation, I Pore Nucleation (not shown), II Rapid Expansion and III Controlled Growth.

