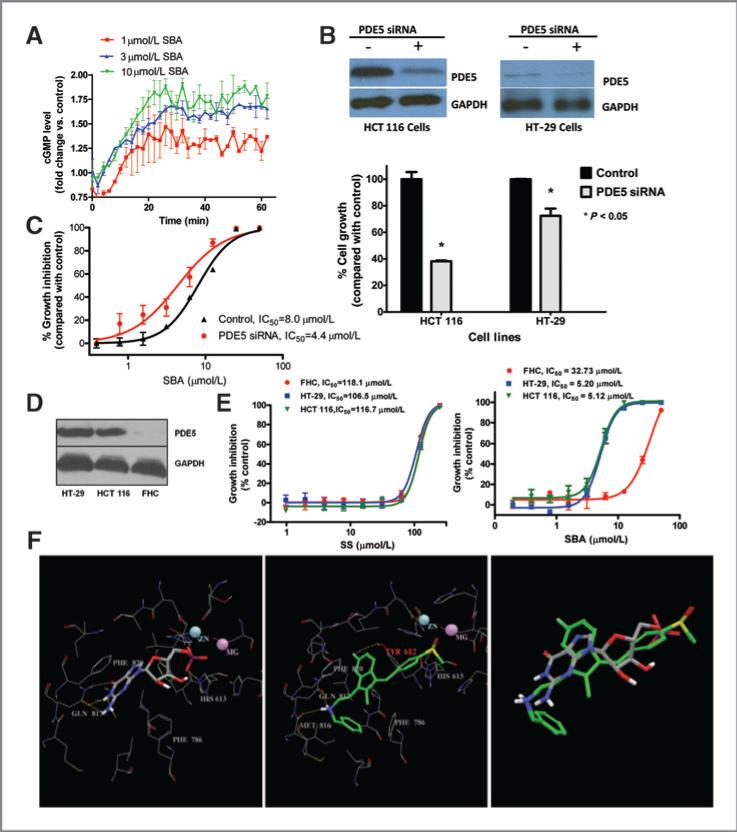
Figure 4.
A, luciferase-based cGMP biosensor assay in HEK293 cells treated with 50 μmol/L SNP in the presence of 1, 3, or 10 μmol/L SBA. B, siRNA suppression of PDE5 and growth in human HCT 116 and HT-29 colon tumor cells following 72-hour transfection. C, growth inhibition by SBA of PDE5 siRNA knockdown HCT 116 cells compared with controls. D, PDE5 expression in human HCT 116 and HT-29 colon tumor cells and FHC. E, growth inhibitory activity of SBA and SS in human HCT 116 and HT-29 colon tumor cells compared with FHC. F, structural representation of GMP and SBA binding to PDE5. The panels show GMP-bound PDE5 (left), docked PDE5-SBA complex structure (middle), and the aligned GMP and SBA (right). Residues within 4 Å of the bound/docked molecules are shown by lines. GMP and SBA molecules are represented in solid sticks and their carbon atoms are colored in gray and green, respectively. Hydrogen-bonds are marked in yellow dashed lines.

