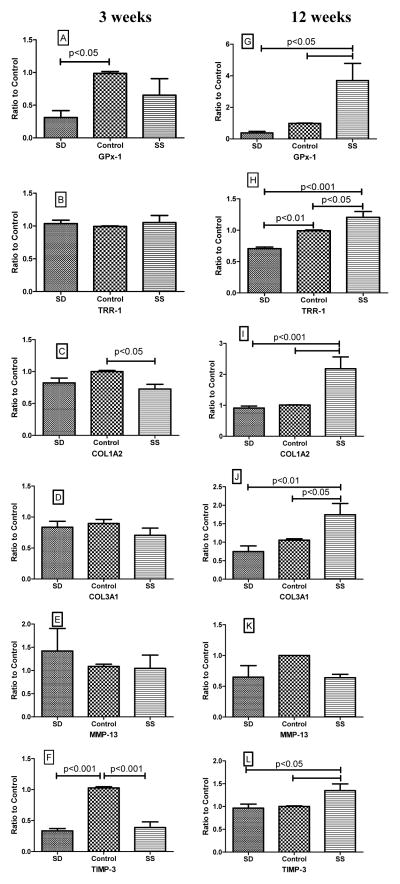
Figure 3. Effect of selenium on myocardial gene expression.
Figures 3A–F demonstrate the effects after 3 weeks of dietary treatment, while figures 3G–L show the effect of selenium after 12 weeks of dietary intervention. Results are expressed as a ratio to the control group. P values obtained by ANOVA are shown in the figure. GPx-1–glutathione peroxidase-1; TRR-1–thioredoxin reductase-1; COL1A2–collagen I alpha2; COL3A1-collagen III alpha1; MMP-13–matrix metalloproteinase-13; and TIMP-3-tissue inhibitor of matrix metalloproteinase-1.

