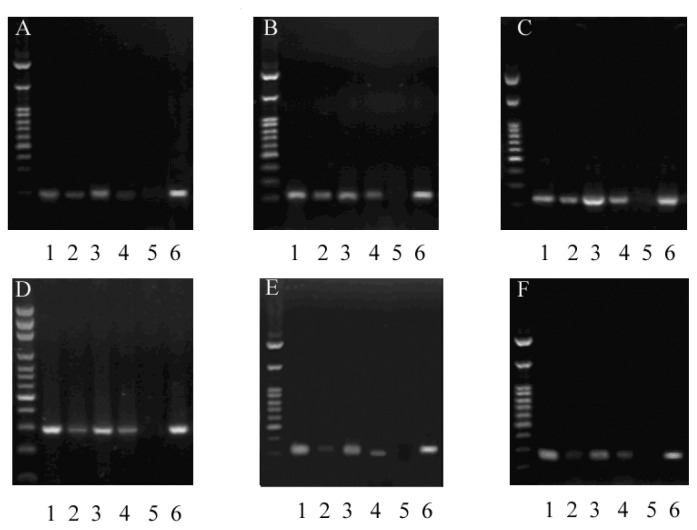
Figure 2.
The levels of promoter methylation were measured by MSP in NYGGF4-overexpression (NYGGF4) and control adipocytes (Conl). Representative profiles of the promoter region of different genes amplified using the U and M primer combination in an agarose gel. Key: U, unmethylated; M, methylated; M+, positive control; M−, negative control. (A) Cox5b; (B) Egfl9; (C) Timm23; (D) Ppp1r8; (E) Cdkn1c; (F) Pip5k1b. Lanes: 1, NYGGF4-U; 2, NYGGF4-M; 3, Conl-U; 4, Conl-M; 5, M−; 6, M+. Marker: 2500, 1500, 1000, 900, 800, 700, 600, 500, 400, 300, 200, 100 bp.

