Figure 3.
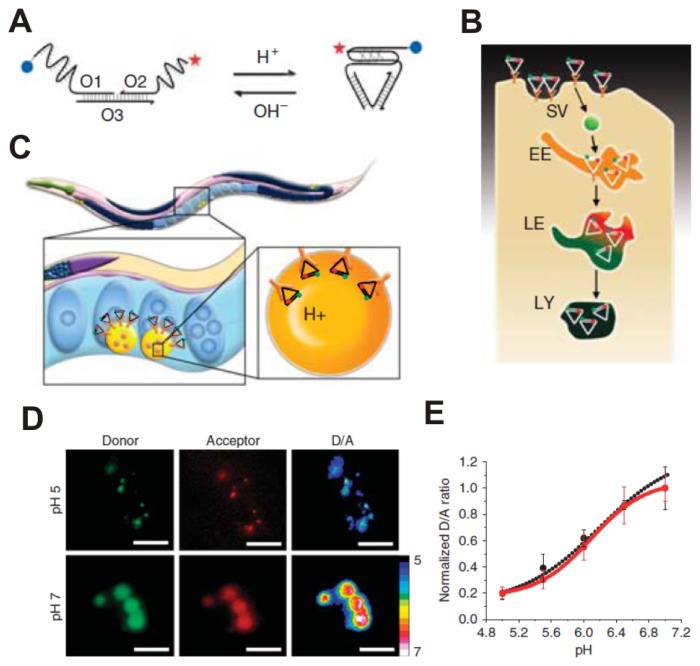
The “I-switch” DNA nanomachine recapitulates its pH-sensing properties in vivo. (A) the structure and working of an I-switch; (B) I-switch uptake in coelomocytes postinjection in C. elegans; (C) Stages in endosomal maturation of receptor-mediated endocytosis of a ligand; (D) donor channel, acceptor channel and respective pseudocolor D/A images of wild-type coelomocytes labeled with I-switch and clamped at pH 5 and 7. Scale bar, 10 ìm; (E) pH calibration curve of I-switch in vivo (red trace) and in vitro (black trace) showing normalized D/A ratios versus pH. Error bars indicate s.e.m. (n = 25 cells, ≥50 endosomes). Figures reproduced with permission from Macmillan Publishers [79].

