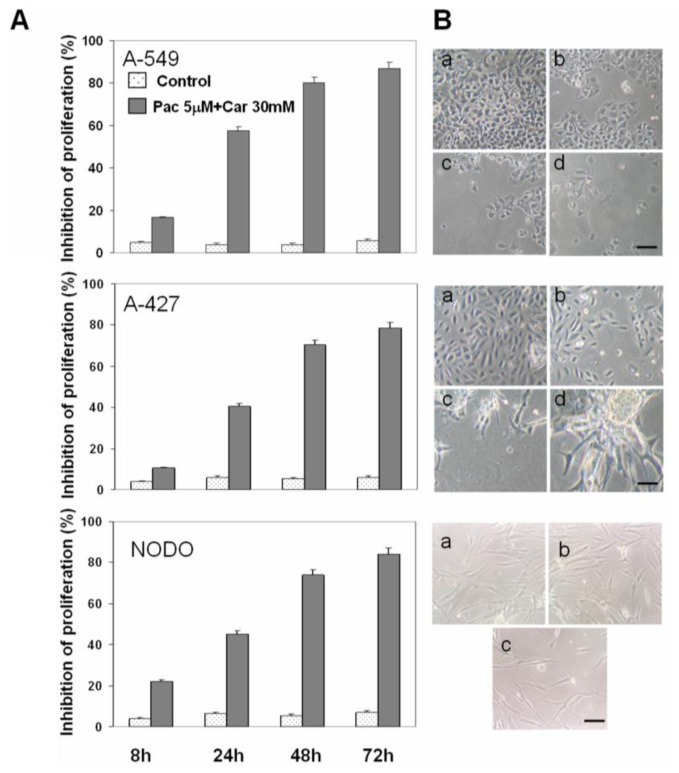
Figure 2.
Effect of plasma concentrations of the Car-Pac combination on NSCLC cell lines. (A) Cell proliferation estimated by the MTT assay, as described in “Methods”. Values are means ± SD of six measurements in four separate experiments; (B) Representative phase-contrast micrographs showing morphological changes observed in NSCLC cell lines after drug exposure at 8 h (a), 24 h (b), 48 h (c) and 72 h (d). Scale bar: 100 μm.

