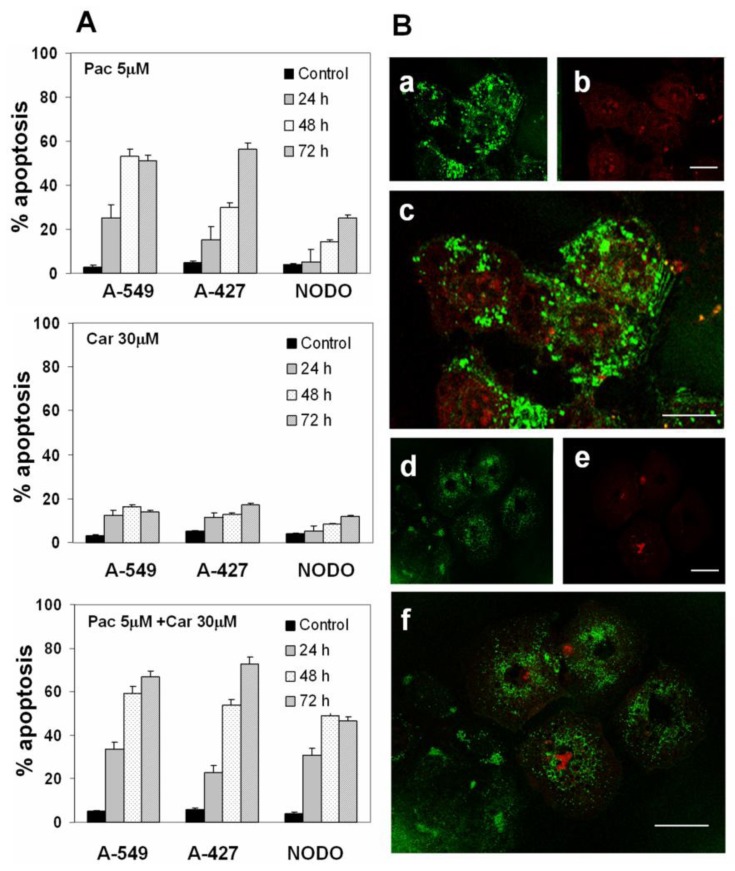
Figure 3.
Apoptosis induced by plasma concentrations of drugs in NSCLC cell lines. (A) Percentage of apoptosis induced by Pac, Car and Pac-Car combination therapy. Values represent means ± SD of quadruplicate cultures; (B) To confirm apoptotic induction, cells were analyzed using annexin V-FITC staining and confocal microscopy. The figure shows representative images of stronger staining in A-549 cells (a: annexin V-FITC staining; b: cell nuclei counterstained with PI; c: overlay) and weak staining in NODO cells (d: annexin V-FITC staining; e: cell nuclei counterstained with PI; f: overlay). The study was carried out at 48 h. Scale bar: 25 μm.

