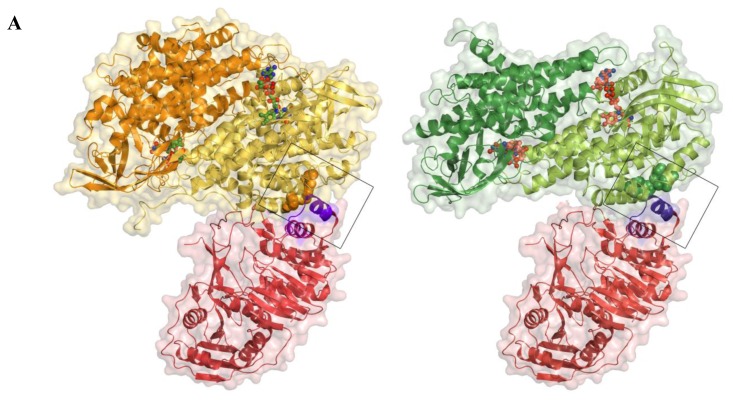
Figure 6.
Model of the docking between AidB and the human ETF. (A) Side-by-side views of the AidB-ETF docking model (left) and the MCAD-ETF complex structure (right), shown in the same orientation. For the docking, the crystal structure of AidB (PDB ID: 3U33 [21]) was superimposed onto the MCAD-ETF complex structure (PDB ID: 1T9G [29]). All structures are shown in ribbon representation, with the ETF in red, AidB protomers in yellow and orange, and MCAD protomers in dark and light green. Only one dimer is shown both for the AidB tetramer and the MCAD tetramer, the second dimer is omitted for clarity in both cases. Transparent surfaces are shown around all proteins in red (ETF), yellow (AidB) and green (MCAD). Bound FAD-cofactors of AidB and MCAD are shown in ball-and-stick representation with carbon atoms in light green and orange, respectively. The ETF recognition loop is shown in purple and interacting hydrophobic residues of AidB and MCAD are shown as orange and green spheres, respectively; (B) Wall-eyed stereo view of the ETF recognition loop interactions. The docking was generated in the same fashion as in (A). The recognition loop is shown in purple ribbons, with Leu195 shown as sticks. MCAD residues from the MCAD-ETF complex structure that are interacting with the recognition loop are shown with pale green carbons. AidB residues near the putative location of ETF Leu195 are shown with yellow carbons. The axes of the recognition loop helix, MCAD helix C, and the corresponding AidB helix are shown and colored by dipole moment from blue (positive) to red (negative); (C) Multiple sequence alignment of ETFs from different organisms. The residue that inserts into the hydrophobic pocket of partner proteins is highlighted in yellow. Other conserved residues are shown in blue. Ec, E. coli (protein YdiQ); Bs, Bacillus subtillis; Mme, Methylophilus methylotrophus; Mb, Mycobacterium bovus; Pd, Paracoccus denitrificans; Ca, Clostridium acetobutylicum; At, Arabidopsis thaliana; Hs, Homo sapiens; Mmu, Mus musculus; Bb, Bos bovus.


