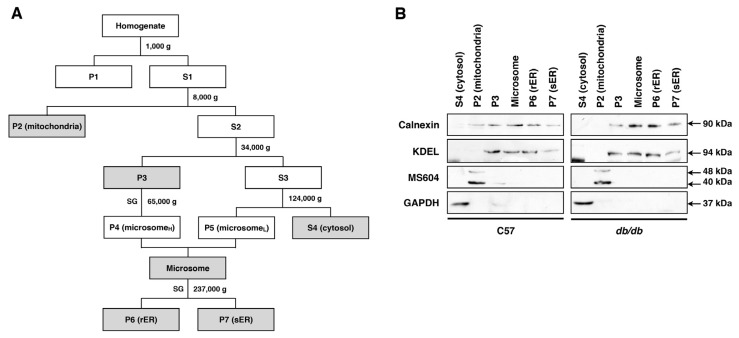
Figure 2.
Subcellular fractionation of mouse liver. (A) Flow diagram for the subcelluar fractionation. P, pellet; S, supernatant; SG, sucrose gradient; (B) Immunoblot assessment of the subcellular fractionation. Calnexin and KDEL are ER markers, MS604 is a mitochondria marker, and GAPDH is a cytosol marker.

