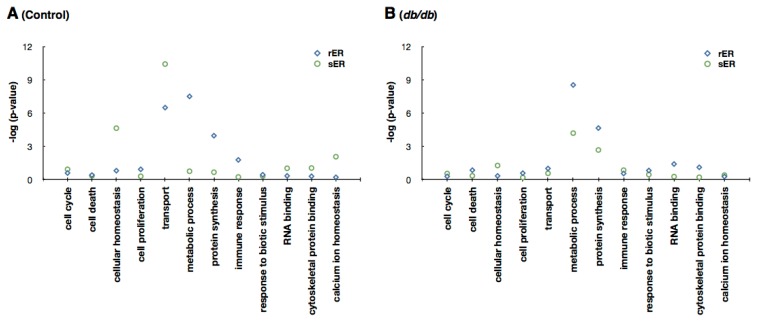
Figure 4.
Functional distribution of proteins among unique proteins of the rER and sER using Gene Ontology (GO) annotation with the hypergeometric test. (A) C57 control mice livers; (B) db/db mice livers. Unique proteins showing that the expression levels are higher at least 1.5-fold in each fraction were used for analysis (for C57 rER, 214 proteins; C57 sER, 166 proteins; db/db rER 148 proteins; db/db sER, 121 proteins). Proteins showing that the expression is higher or lower at least 5-fold are considered as exclusively expressed proteins in the indicated fraction. The degree of enrichment or depletion of identified proteins in a given function category is represented as −log(p).

