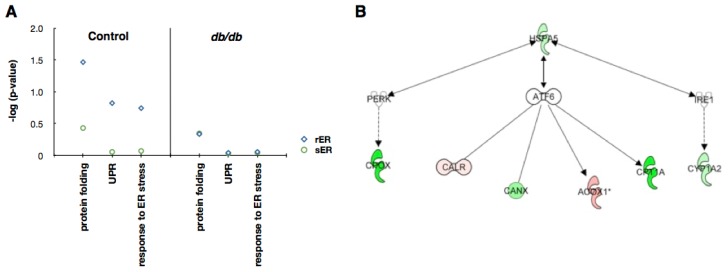
Figure 5.
Proteins associated with ER stress. (A) Functional distribution of proteins involved in ER stress using Gene Ontology (GO) annotation with the hypergeometric test. Unique proteins showing that the expression levels are higher at least 1.5-fold in each fraction were used for analysis. The degree of enrichment or depletion of identified proteins in a given function category is represented as −log(p); (B) Protein network analysis. IPA-determined network of identified proteins in the rER that may be involved in ER stress signaling. Red, up-regulated in db/db mouse liver; green, down-regulated in db/db mouse liver.

