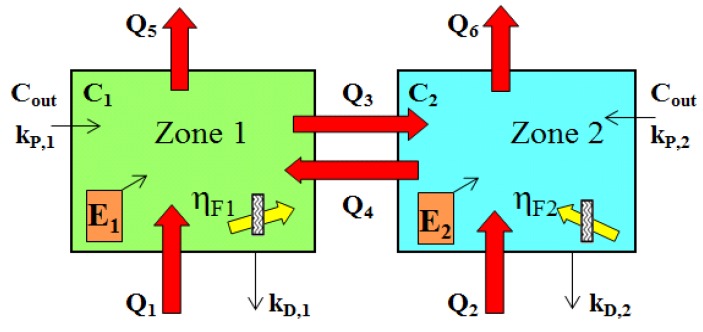
Figure 1.
Configuration of the well mixed two-zone model, also, schematic of the two zone IAQ model, showing flows Q1 to Q6 (m3·h−1); concentrations Cout, C1 and C2 (mg·m−3); emission rates E1 and E2 (mg·h−1); particle penetration factors kP,1 and kP,2 (dimensionless); deposition loss rates kD,1 and kD,2 (h−1); and capture efficiency of filters ηF1 and ηF2 (dimensionless).

