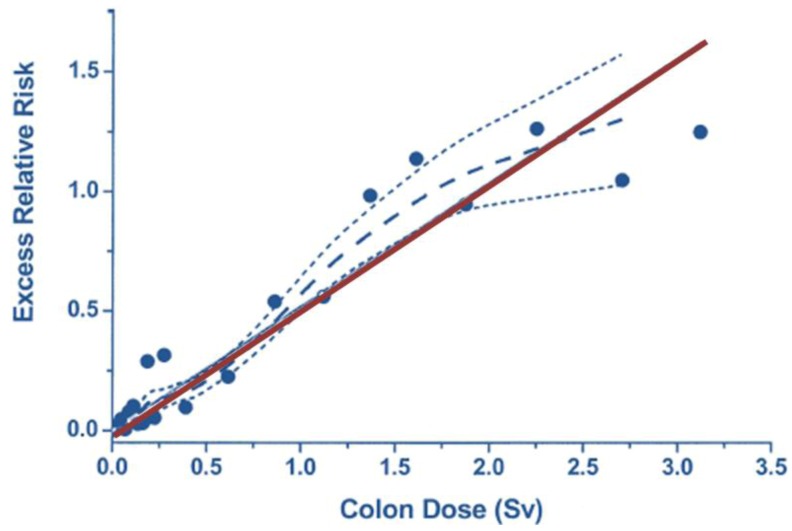
Figure 3.
Excess relative risk of solid cancers derived from the Life Span Study cohort of A-bomb survivors over the dose range 0 to 2 Sv, to which a straight line is fitted. The solid straight line is the linear slope estimate, the points are dose category-specific ERR estimates, the dashed curve is a smoothed estimate derived from the points. The dotted curves indicate upper and lower one-standard-error bounds on the smoothed estimate (reproduced with permission from [8]).

