Fig. 2.

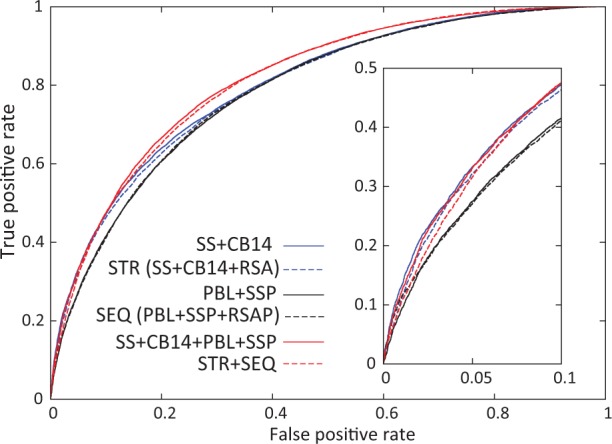
ROC curves of selected neural network predictions. Two best neural networks using structure features (blue lines), sequence features (black lines) and combined features (red lines) are shown

ROC curves of selected neural network predictions. Two best neural networks using structure features (blue lines), sequence features (black lines) and combined features (red lines) are shown