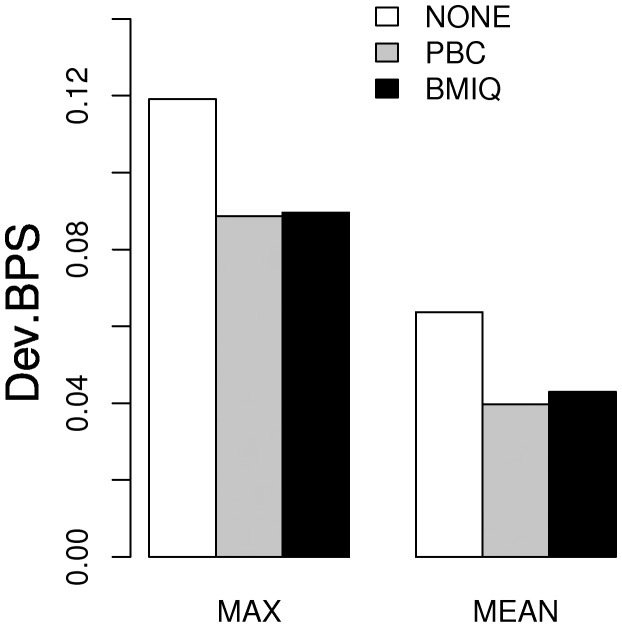
Fig. 3.
Barplot comparing the maximum and mean absolute deviation of 450 k values from their corresponding bisulphite pyrosquencing values over the nine type2 probes considered in Dedeurwaerder et al., (2011). We compare these deviation measures for the case of no design normalization (NONE), PBC normalization and BMIQ

