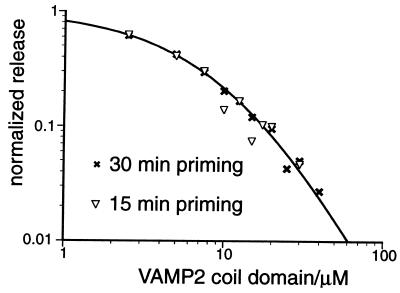
Figure 5.
Increasing priming time does not change the shape of the dose-dependent inhibition curve. Data from a 30-min priming, 2-min triggering experiment (×, n = 2.6) is compared with that of a 15-min priming, 2-min triggering experiment (▿, n = 3.2). The curve plotted shows the best-fitting curve for the 30-min priming dataset.

