Fig. 2.
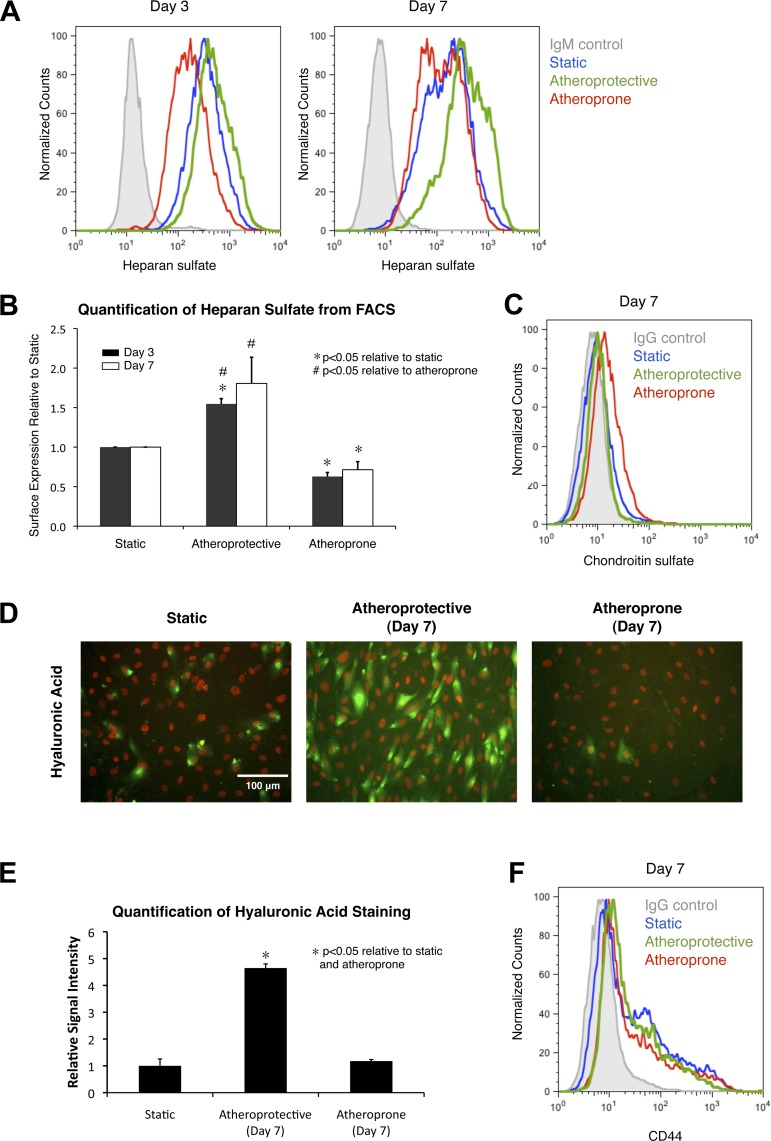
Exposure to atheroprotective waveform leads to induced expression of heparan sulfate and hyaluronic acid, but not chondroitin sulfate. A: representative flow cytometry histogram of surface heparan sulfate expression on cell cultured under static condition or cell exposed to atheroprotective or atheroprone flow for 3 or 7 days. B: quantitative analysis of flow cytometry data from 3 independent experiments. Values are means ± SE (n = 3). C: flow cytometry histogram of surface expression of chondroitin sulfate on cell cultured under static condition or cell exposed to atheroprone or atheroprotective shear stress waveform for 7 days. D: representative immunostaining images of hyaluronic acid in cell cultured under static condition or cell exposed to atheroprotective or atheroprone flow for 7 days. Hyaluronic acid is shown in green, and nucleus [4′,6-diaminido-2-phenylindole (DAPI)] is shown in red. E: quantitative analysis of hyaluronic acid staining signal based on immunostaining images in D. Values are means ± SE (n = 3). F: flow cytometry histogram of surface expression of CD44 on cell cultured under static condition or exposed to atheroprotective or atheroprone shear stress waveform for 7 days.

