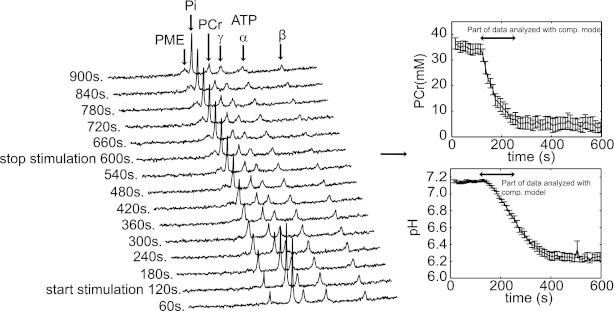
Fig. 3.
Characterization of in vivo pathway dynamics. Typical result of the experimental data obtained to characterize in vivo pathway behavior. A: stack plot of spectra obtained at 10-Hz stimulation. These spectra were obtained by averaging 12 free-induction decays and processed with 5-Hz line broadening. PME, Pi, phosphocreatine, PCr, and ATP resonances are indicated. Pooled PCr (B) and pH (C) dynamics at 10-Hz stimulation (n = 5). Error bars indicate SE. The part of the data analyzed by the computational model is indicated by a black arrow.

