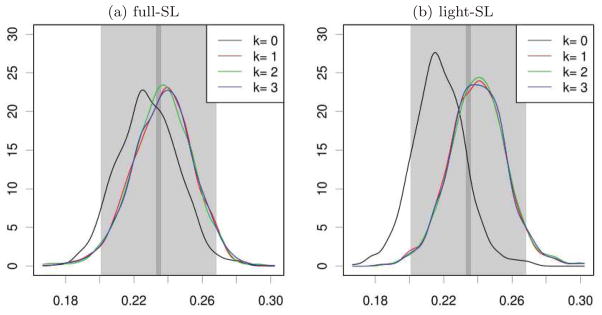
Fig 3.

Empirical distribution of { } based on n = 200 independent observed data structures for k = 0 (initial estimator) and k iterations of the updating procedure (k = 1, 2, 3), as obtained from B′ = 103 independent replications of the simulation study (using a Gaussian kernel density estimator). (a). The super-learning procedure involves all algorithms described in Section 6.5. (b). The super-learning procedure only involves algorithms based on generalized linear models. In both graphics, gray rectangles represent 95%-accuracy intervals and for the true parameter Ψ (Ps) based on 200 observed data structures (light gray) and B = 105 observed data structures (dark p gray). The length of is the optimal length of a 95%-confidence interval based on an efficient (regular) estimator of Ψ (Ps) relying on n observations (assuming that the asymptotic regime is reached).
