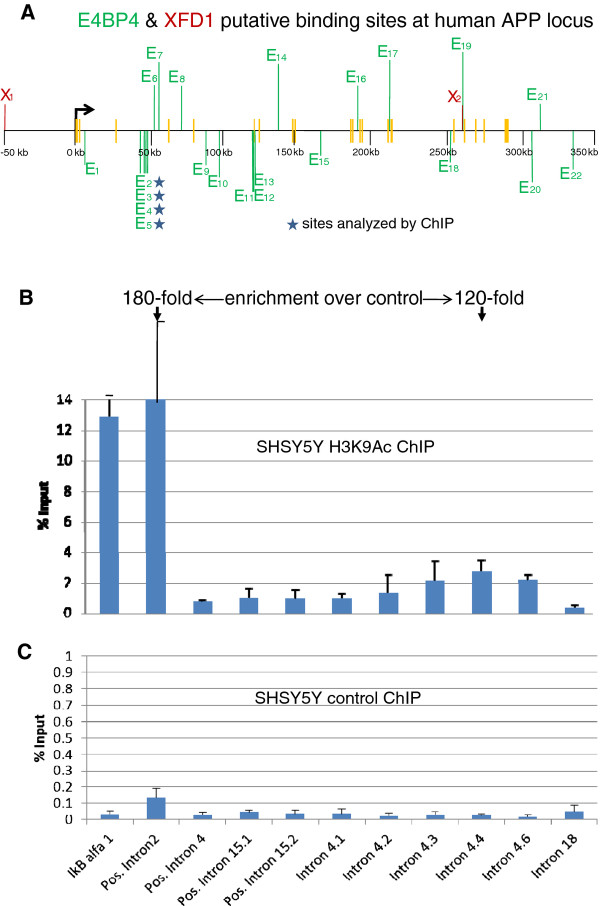
Figure 6.
Panel A: Location of E4BP4 (E, green) and XFD1 (X, red) sites in non-coding DNA within the human APP gene and surrounding 50 kb DNA. The green and red vertical lines above or below the horizontal line indicate sites in the forward and reverse strand of DNA, respectively. The short yellow vertical bars indicate exons of APP. The first three exons are very close to one another near the transcription start site. Stars indicate the E4BP4 sites marked by H3K9Ac in chromatin immunoprecipitation (ChIP) assays in a human cell-line SHSY5Y expressing APP gene. The bent arrow indicates transcription start site of APP gene. The SHSY5Y cells were analyzed by ChIP using anti-H3K9Ac antibodies as described in Methods. Y-axis represents the amount of material present in anti-H3K9Ac (Panel B) or non-specific IgG (Panel C) immunoprecipitates compared to input chromatin used for the assay. Note the different scales for the two panels. Results shown are the average of three independent ChIP experiments, each of which was assayed in duplicates. Error bars represent standard deviation between experiments. Amplification from IkBα served as a positive control. The fold enrichment, over control IgG, of H3K9Ac activity at the APP intron 2 site (positive control) and the intron 4 sites are 180-fold versus 120-fold, respectively, as indicated at the top of Panel 6B.

