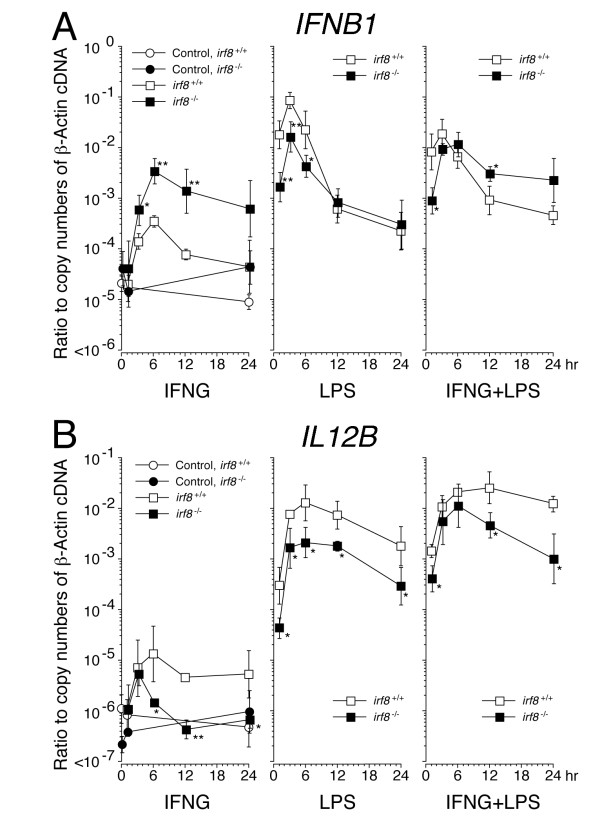
Figure 8.
Kinetics of IFNB1 (A) and IL12B (B) mRNA levels in Irf8+/+ and Irf8-/- microglia after the exposure to IFNγ and lipopolysaccharide. Purified microglia were incubated in medium alone (Control, closed and open circle in the left panels) or in the presence of IFNγ (IFNG, 100 ng/ml), lipopolysaccharide (LPS, 100 ng/ml) or both (IFNG + LPS) for 24 h. IFNB1 and IL12B mRNA at the indicated time points were quantified by qPCR and are plotted as ratios to copy numbers of β-actin cDNA on a logarithmic scale. Data were calculated from at least three independent experiments in each genotype. At time 0, data from controls are only shown. **P < 0.01 and *P < 0.05, in a comparison of the two genotypes at the indicated time points.

