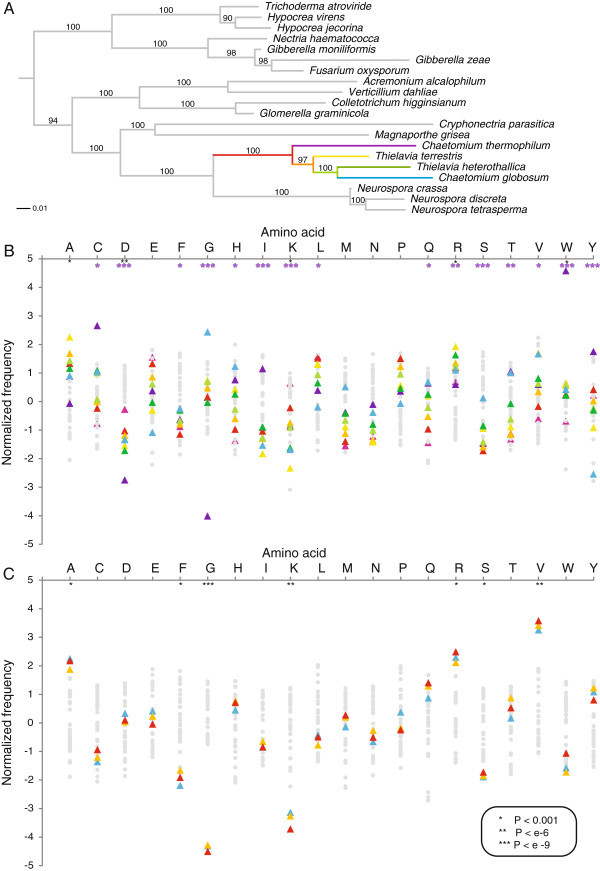
Figure 1.
Evolution of thermophily in Sordariomycetes.A) Maximum likelihood tree of Sordariomycetes based on 40 marker genes. Numbers on branches indicate bootstrap values. The mesophilic fungus Chaetomium globosum clusters within the thermophiles with 100% bootstrap support. B) Amino acid frequencies in single copy proteins and reconstructed ancestral proteins were normalized for average and standard deviation. Coloured triangles are according to the colours of the branches in A: blue Cgl; dark green Tht; light green ancestor of Cgl and Tht; yellow Tht; orange ancestor of Tte and Cgl; purple Cth; red ancestor of Cth and Cgl. Black stars indicate significant differences between the thermophiles and the mesohpiles, purple stars between C. thermophilum and the mesophiles C) Amino acid frequencies of single copy proteins within the sub Class of Eurotiomycetidae, containing two sequenced thermophiles; Thermomyces lanuginosis and Talaromyces thermophilus. Black stars indicate significant differences between the thermophiles and the mesohpiles.

