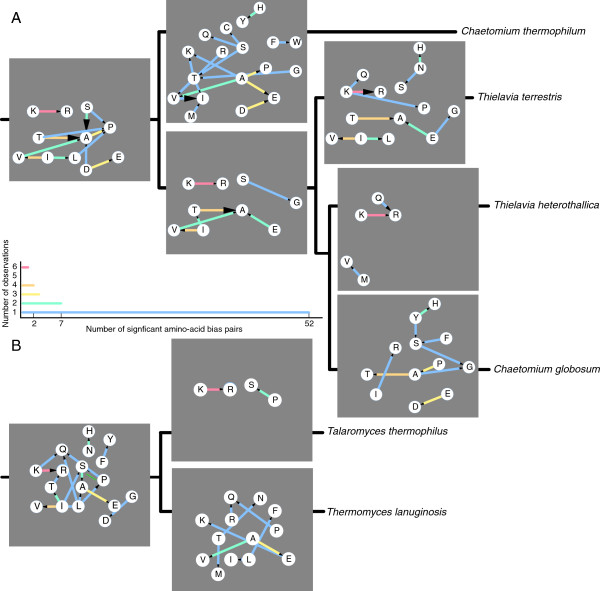
Figure 3.
Biases in pairwise mutation rates. Alignments were made of all single copy orthologous groups and subjected to parsimony reconstruction using the marker gene tree as a guide tree. The frequencies of mutations between all pairs of amino acids were analysed. The ratios between all pairs of amino acids were compared to the ratios in the reconstructed phylogeny between mesophiles. In principle, it is expected that there are as many mutations from X to Y as from Y to X. Thus a bionomial test can be used to assess a bias. However, there are also biases in the complete groups of Sordariomycetes and Eurotiomycetidae. Therefore the expected ratio is not set to 1:1, but to the actual ratio in the mesophilic neighboring species. Amino acid pairs with significant bias are connected by coloured lines, with an arrowhead proportional to the bias in the direction of the more frequent mutations. A histogram of bias pairs is showing how often among all nine branches the bias pair is observed, colours are used to connect the amino acids in A) thermophilic Sordariomycetes and B) thermophilic Eurotiomycetidae.

