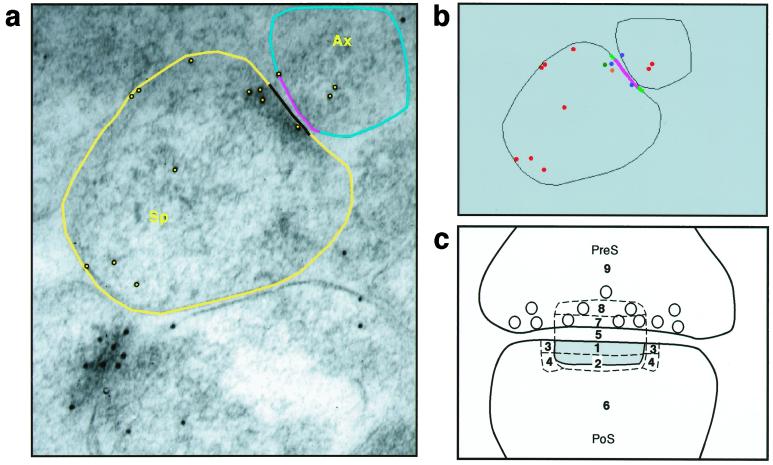
Figure 2.
Bin analysis of synaptic NR1. Images illustrate software used for this analysis. (a) Outlines of the relevant synaptic components, i.e., presynaptic and postsynaptic membranes, length of the postsynaptic density (PSD), and length of the presynaptic membrane that corresponds to the length of the PSD. (b) The program provides a data map of the distribution of gold particles relative to these membranes. (c) A schematic diagram of different postsynaptic (PoS) compartments. Two major postsynaptic bins were designated: Bin 1 is 0–30 nm from the inner leaflet of the postsynaptic membrane, and Bin 2 is 30–60 nm from the postsynaptic membrane. Bins 3 and 4 are side bins, 15 nm lateral to Bins 1 and 2. Bin 5 is the synaptic cleft; Bin 6 is a cytoplasmic bin that includes gold particles >60 nm from the postsynaptic membrane. Two major presynaptic (PreS) zones were designated: Bin 7 is 0–30 nm from the inner border of the presynaptic membrane; Bin 8 is 30–60 nm from the presynaptic membrane. Bin 9 is a presynaptic bin that includes gold >60 nm from the presynaptic membrane. Sp, spine; Ax, Axon.

