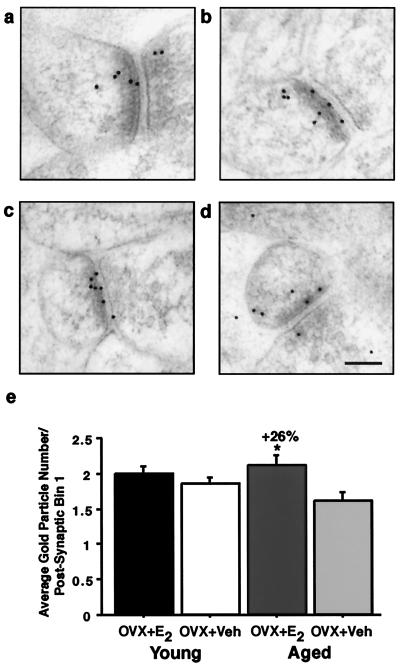
Figure 3.
Bin analysis of NR1 in young and aged OVX + E2 and OVX + Veh. Images from young (a and b) and aged (c and d) animals illustrating the distribution of the NR1 postembedding immunogold. (e) Analysis revealed no significant differences in the synaptic distribution of NR1 between the young (a) OVX + E2 and (b) OVX + Veh (P > 0.15). However, the aged (c) OVX + E2 had significantly more NR1 per postsynaptic Bin 1 compared with (d) OVX + Veh (P < 0.05). (Bar = 100 nm.)

