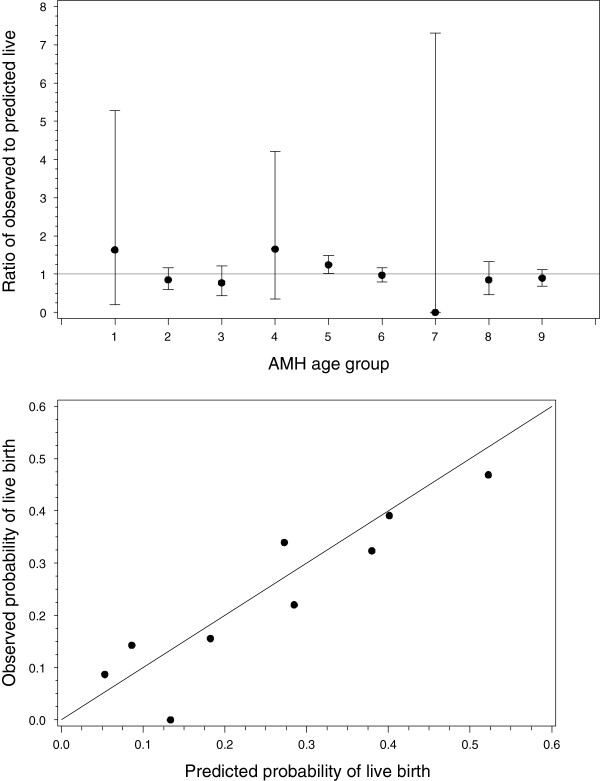
Figure 1.
Top panel: Plot of observed/predicted probabilities of a live birth with 95% confidence intervals. No data met the criteria for group seven. Lower panel: Calibration plot of the predicted probability versus observed probability of live birth for the nine groups, with a line of equality. In the figure the point corresponding to zero refers to the category for which no patients met the appropriate age and AMH criteria.

