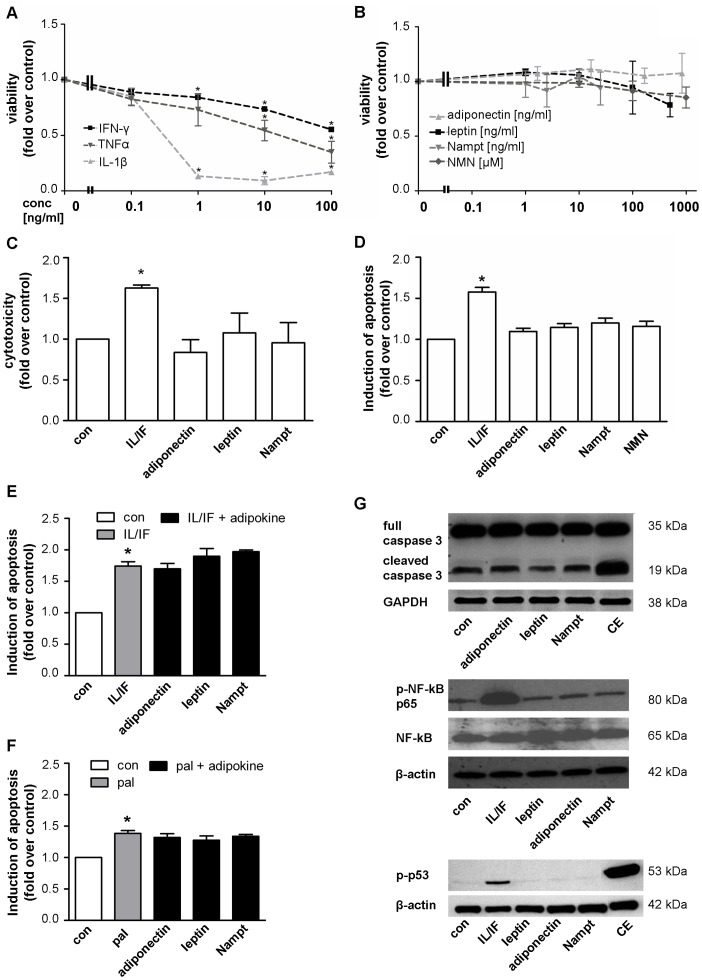
Figure 1. The adipocytokines leptin, adiponectin, Nampt and NMN have no direct effects on beta-cell survival in INS-1E cells.
INS-1E cells were kept under serum-free conditions 24 h before and during the 48 h experiment. (A,B) INS-1E cells were exposed to cytokines (A: IL-1β, IFN-γ or TNFα) or adipocytokines (B: adiponectin, leptin, Nampt, NMN) at the indicated concentrations for 48 h and cell viability was measured by WST-1 assay. Data are shown as means ±SEM of 3 independent experiments performed in triplicates. Statistical analyses were performed by one-way ANOVA with Bonferroni’s Multiple Comparison Test as posthoc test. C,D: INS-1E cells were exposed to adipocytokines (adiponectin 167 ng/ml, leptin 200 ng/ml, Nampt 2.5 ng/ml, NMN 100 µM) or a cytokine combination (10 ng/ml IL-1β+10 ng/ml IFN-γ) for 48 h. Cytotoxicity (C) was analyzed by measuring the release of adenylate kinase into the supernatant and (D) apoptosis was measured by FITC-annexinV (An) and propidium iodide (PI) staining and subsequent flow cytometric analysis of An-positive and double An/PI positive cells. Results were expressed relative to cells exposed to serum free medium (con) and as means ±SEM of three independent experiments performed in triplicates. E,F: INS-1E cells were exposed to a cytokine combination (IL/IF; 10 ng/ml IL-1β+10 ng/ml IFN-γ) (E) or 0.25 mM palmitate (pal) (F) for 48 h in the absence or presence of the adipocytokines (167 ng/ml adiponectin, 200 ng/ml leptin, 2.5 ng/ml Nampt) and induction of apoptosis was measured by An/PI staining and flow cytometric analysis. Data are shown as means ±SEM of triplicates of three independent experiments. Statistical analyses were performed by student´s t-test. G: INS-1E cells were exposed to the adipocytokines adiponectin (167 ng/ml), leptin (200 ng/ml) or Nampt (2.5 ng/ml) or a combination of camptothecin (2 µM) and etoposide (85 µM; CE, upper and lower panel) or a cytokine combination (10 ng/ml IL-1β+10 ng/ml IFN-γ, middle and lower panel). Western blot analyses were performed for full length and cleaved caspase-3 (upper panel), phospho-NF-κB p65 (Ser536) and NF-κB p65 (middle panel) and phospho-p53 (Ser15) (lower panel). GAPDH or beta-actin were used as loading control. All panels show one typical blot out of three independent experiments. *p<0.05 compared to untreated control.

