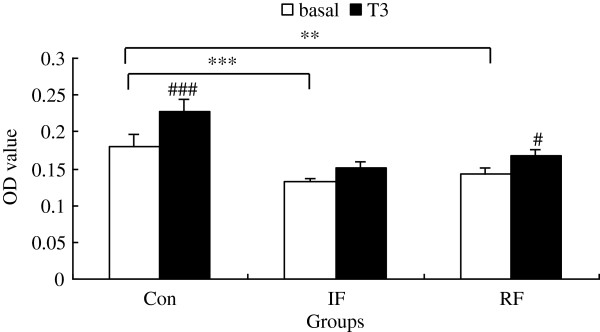
Figure 5.

Effect of T3on viability of chicken satellite cells at 24 hours according to feeding group. Con: control group; IF: intermittent feeding group; RF: re-feeding group. Cells were seeded at 104 cells per well in a 96-well plate, 6 wells for each group and allowed to attach overnight. Then cells were rendered quiescent in low serum medium for 24 hours. Three wells of each group were treated with or without T3 in low serum medium for another 24 hours. Cell viability was assessed by the MTT assay as OD value. Values are means ± SEM. Significant differences are indicated, **–***: significance within the basal medium among three different feeding strategy groups (**P<0.01, ***P<0.001), #–###: significance within the same feeding strategy group after T3 treatment vs. basal (#: P<0.01, ###: P<0.001). N = 3, N is the culture numbers.
