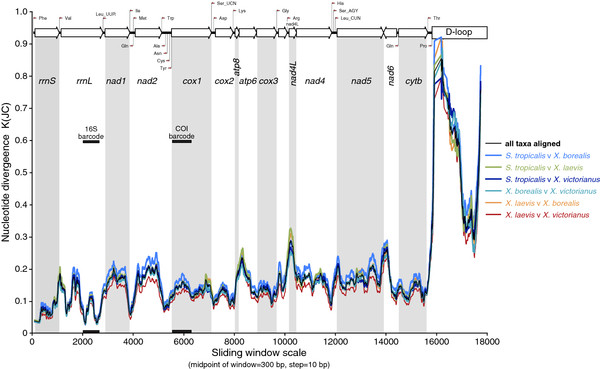
Figure 4.
Sliding window analysis of complete mitochondrial genome sequences of xenopus frogs. The coloured lines show the value of nucleotide divergence K(JC) (average number of nucleotide substitutions per site between species with Jukes and Canor correction) in a sliding window analysis of window size 300 bp with step size 10 for: all four xenopus (black), ST v XL (green), ST v XB (light blue), ST v XV (dark blue), XL v XB (orange), XB v XV (turquoise) and XL and XV (red). Gene boundaries and primers and regions commonly used in DNA barcoding amphibians are indicated.

