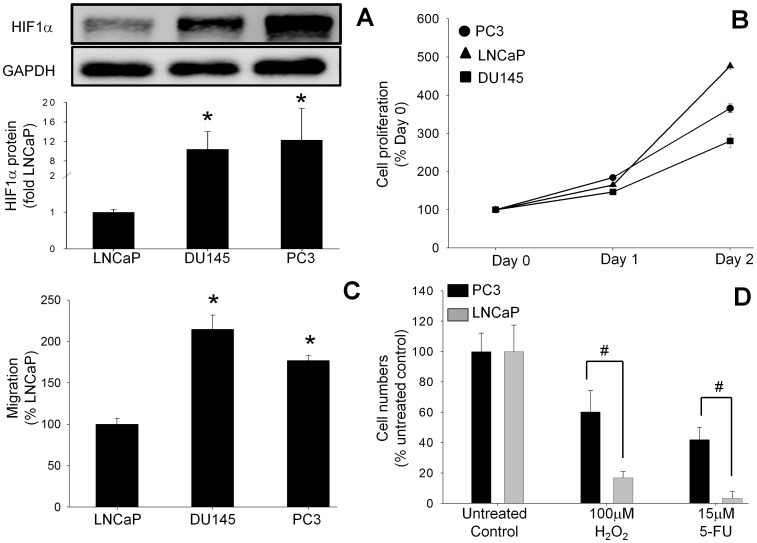
Figure 1. Basal HIF1α protein expression, proliferation rates and migration/invasion rates in human PC cell lines. (.
A) Basal HIF1α protein concentrations in the human PC cell lines LNCaP, DU145 and PC3 under normoxic conditions were analyzed by Western blot. (B) Proliferation was assayed by cell counting after 24 and 48 hours. (C) Migration/invasion rates were measured by Transwell assays at 24 hours. Values in (A) and (C) are expressed as the fold increase compared to LNCaP cells, while the values in (B) are expressed as a percentage of the time 0 value. All values are the mean ± SEM of at least three separate treatments. (D) Survival rates of PC cells exposed to cytotoxic conditions. The survival of PC3 cells (which have higher basal HIF1α protein) when exposed to oxidative stress with hydrogen peroxide (H2O2) or chemotoxicity with 5-fluorouracil (5-FU) was compared to the survival of LNCaP cells (which have lower HIF1α expression). Survival was assessed by counting cell numbers at 24 hours. Values are expressed as a percentage of the untreated control and are the mean ± SEM of at least three separate treatments. #, P<0.05 versus treated LNCaP cells.

