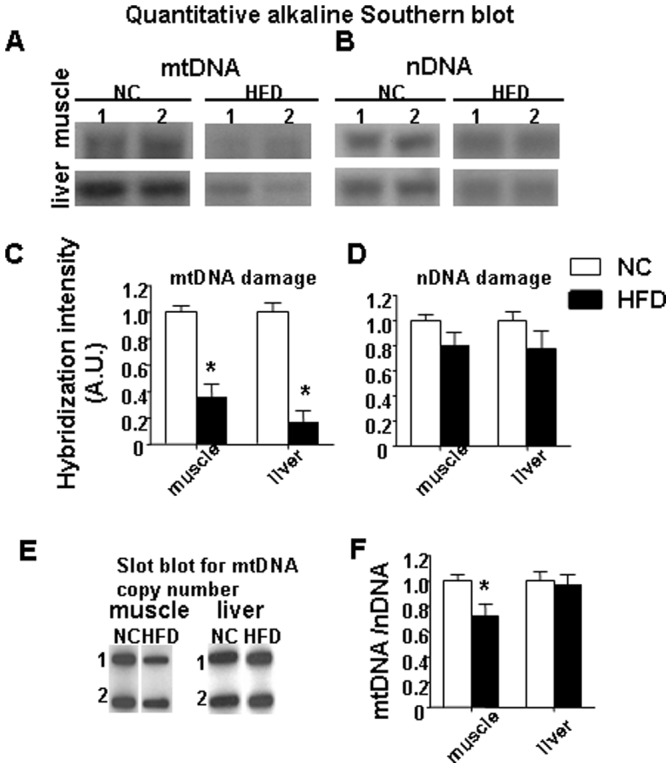
Figure 2. HFD damaged mtDNA to a greater extent than nDNA in both skeletal muscle and liver.

Representative autoradiograms from Southern blot analyses of (A) mtDNA and (B) nDNA are shown for skeletal muscle and liver from two NC and two HFD mice. (C) displays the graphs for mtDNA damage. (D) the graphs for nDNA damage are shown. (E) are representative autoradiograms from slot-blot analyses performed on the DNA from skeletal muscle and liver isolated from two NC and two HFD mice. (F) mtDNA copy number normalized to nDNA copy number in the gastrocnemius muscle and liver. Data represent the means ± SE. (*p<0.05 vs corresponding NC, n = 7–9 mice per group).
