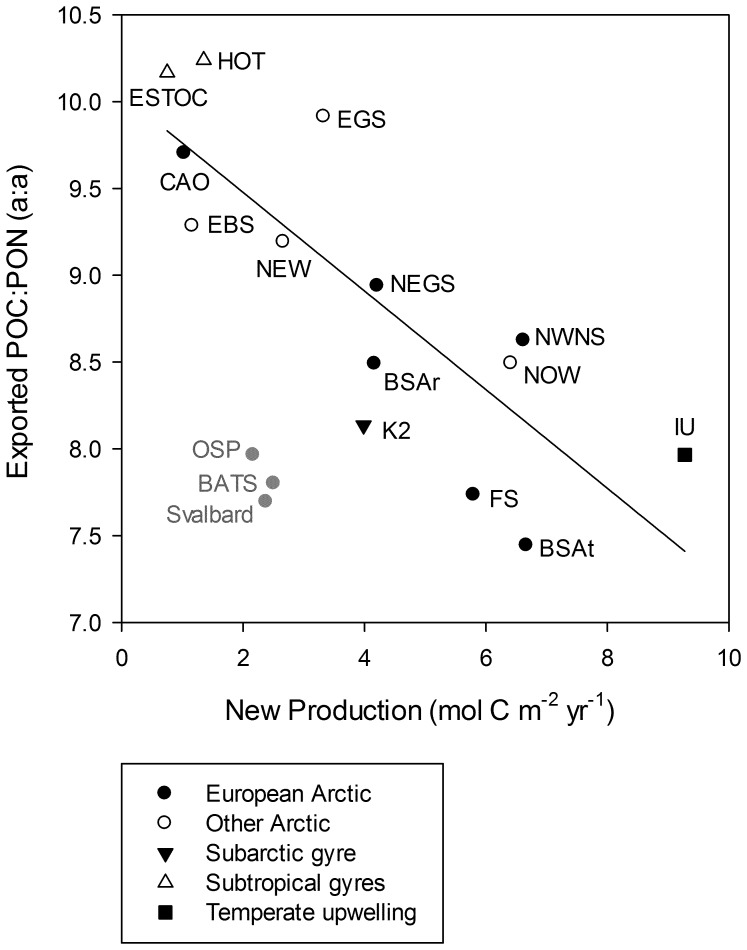
Figure 4. Mean exported POC:PON ratio for each region against average annual new production.
The regression (y = −0.2840x+10.0450, N = 14) is significant (P = 0.0004) with an R2 of 0.66. The Svalbard shelf break was excluded from the regression due to its advective nature (see Methods). See Table 2 for abbreviations for individual sites. Regions shown for comparison but which are not included in the regression (in grey) are Svalbard, NE subarctic Pacific (OSP) and W Sargasso Sea (BATS).

