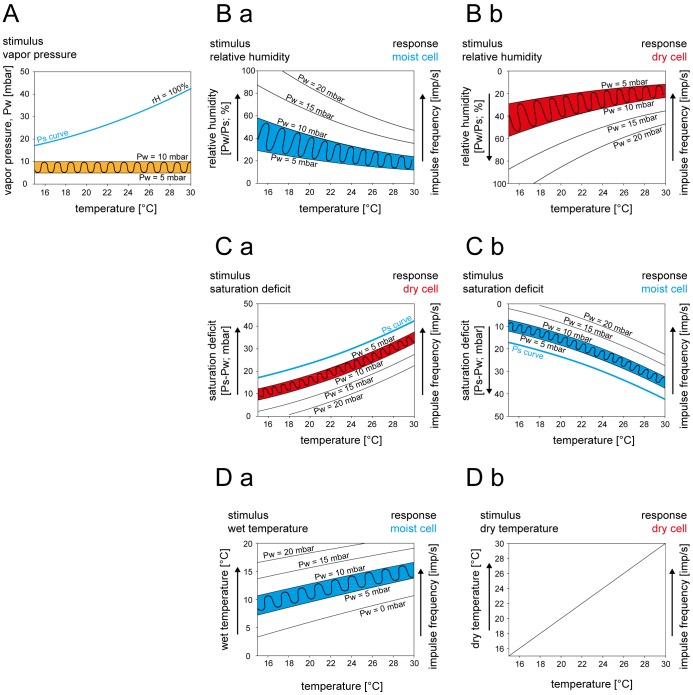
Figure 2. Effects of atmospheric temperature on the hygroreceptors responses as predicted by the three humidity transduction models.
A. Humidity stimulation consists of constant amplitude oscillating change in vapor pressure, illustrated by the orange zone. Ba. The constant amplitude oscillating change in vapor pressure in A produces, with rising temperature, continuously deceasing oscillations in relative humidity (left axis), illustrated by the blue zone. Impulse frequency of a moist cell responding to oscillations in relative humidity is predicted to oscillate within blue zone (right axis). Bb. Same plot as in Ba but with turned y-axis (left axis) to illustrate the relative humidity stimulus eliciting excitatory responses in a dry cell. Impulse frequency of a dry cell responding to oscillations in relative humidity is proposed to oscillate within red zone (right axis). Ca. Constant amplitude oscillating change in vapor pressure in A produces, with rising temperature, continuously increasing oscillations in saturation deficit (left axis), illustrated by the red zone. Impulse frequency of a dry cell responding to oscillations in saturation deficit is predicted to oscillate within red zone (right axis). Cb. Same plot as in Ca but with turned y-axis (left axis) to illustrate the saturation deficit stimulus eliciting excitatory responses in a moist cell. Impulse frequency of a moist cell responding to oscillations in saturation deficit is predicted to oscillate within blue zone (right axis). Da. Constant amplitude oscillating change in vapor pressure in A produces, with rising temperature, continuously increasing oscillations in wet-bulb temperature (left axis), illustrated by the blue zone. Impulse frequency of a moist cell responding to oscillations in wet-bulb temperature is predicted to oscillate within blue zone (right axis). Db. Dry-bulb temperature as function of air temperature. Impulse frequency of a dry cell responding to the dry-bulb temperature is predicted to increase with rising temperature (right axis). Pw water vapor pressure, Ps saturation water vapor pressure. Arrows point in the direction of increasing axis values.

