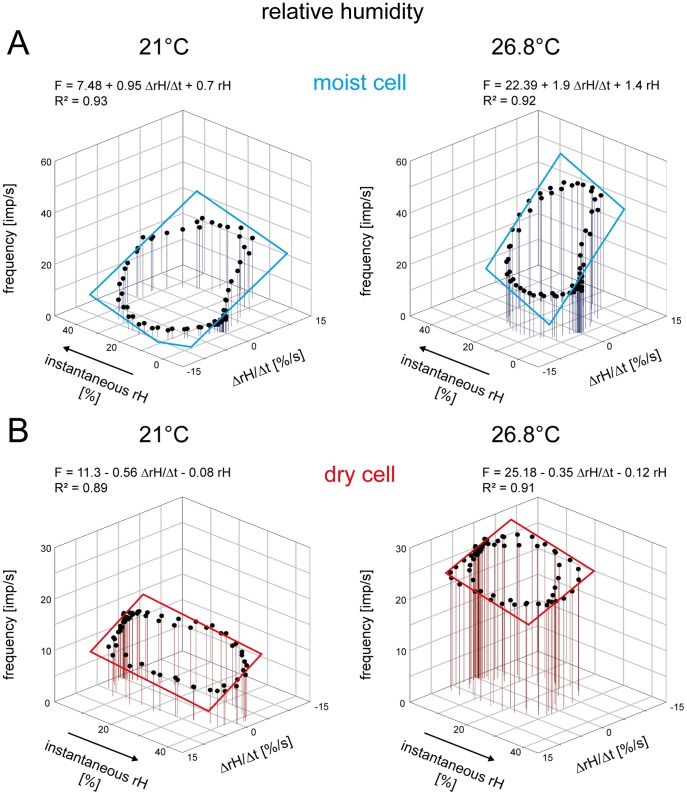
Figure 7. Humidity stimulation expressed as relative humidity.
Impulse frequency of a moist cell (A) and a dry cell (B) from the same sensillum during oscillating changes in relative humidity at two different temperatures, plotted as function of instantaneous relative humidity and the rate with which the relative humidity changes. Regression planes [F = yo+a (ΔrH/Δt)+b rH; where F is the impulse frequency and yo is the intercept of the regression plane with the F axis reflecting is the height of the regression plane] were utilized to determine the gain values for instantaneous relative humidity (b-slope) and its rate of change (a-slope). Impulse frequency of the moist cell (A) increases linearly with rising instantaneous relative humidity and its rate of change, in the dry cell (B) with falling instantaneous relative humidity and its rate of change. R2, coefficient of determination; the number of points per plot was 60. Arrows point in the direction of increasing axis values. F impulse frequency, rH relative humidity.

