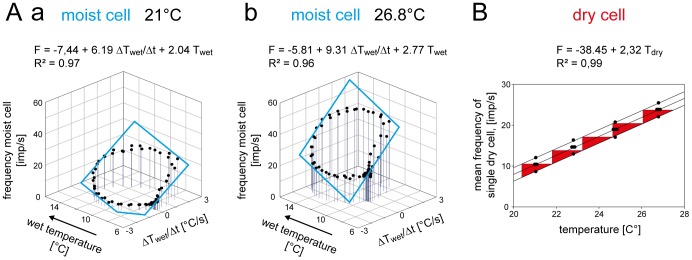
Figure 11. Humidity stimulation based on the wet- and dry-bulb principle.

A. Impulse frequency of the moist cell (A) and the dry cell (B) of Fig. 7 during oscillating changes in the wet-bulb temperature at two different temperatures, plotted as function of instantaneous wet-bulb temperature and the rate with which the wet-bulb temperature changes. Regression planes [F = yo+a (ΔTwet/Δt)+b Twet; where F is the impulse frequency and yo is the intercept of the regression plane with the F axis reflecting the height of the regression plane] were utilized to determine the gain values for the instantaneous wet-bulb temperature (b-slope) and its rate of change (a-slope). Impulse frequency of the moist cell increases linearly with rising instantaneous wet-bulb temperature and its rate of change. B. Impulse frequency of the dry cell of Fig. 7B as function of the dry-bulb temperature (air temperature) during oscillating changes in the wet-bulb temperature at 4 different temperatures. Relationship approximated by linear regression [f = yo+aT]. Resolving power of impulse frequency for dry-bulb temperature (the number of discrete steps which impulse frequency can distinguish within the temperature range). The band width is determined by means and standard deviations of the responses to the dry-bulb temperature when testing the effect of oscillating changes in the wet-bulb temperature. The band enables 5 steps to be distinguished. R2, coefficient of determination; the number of points per plot in A was 30, in B, 5. Arrows point in the direction of increasing axis values. F impulse frequency, Twet wet-bulb temperature, Tdry dry-bulb temperature.
