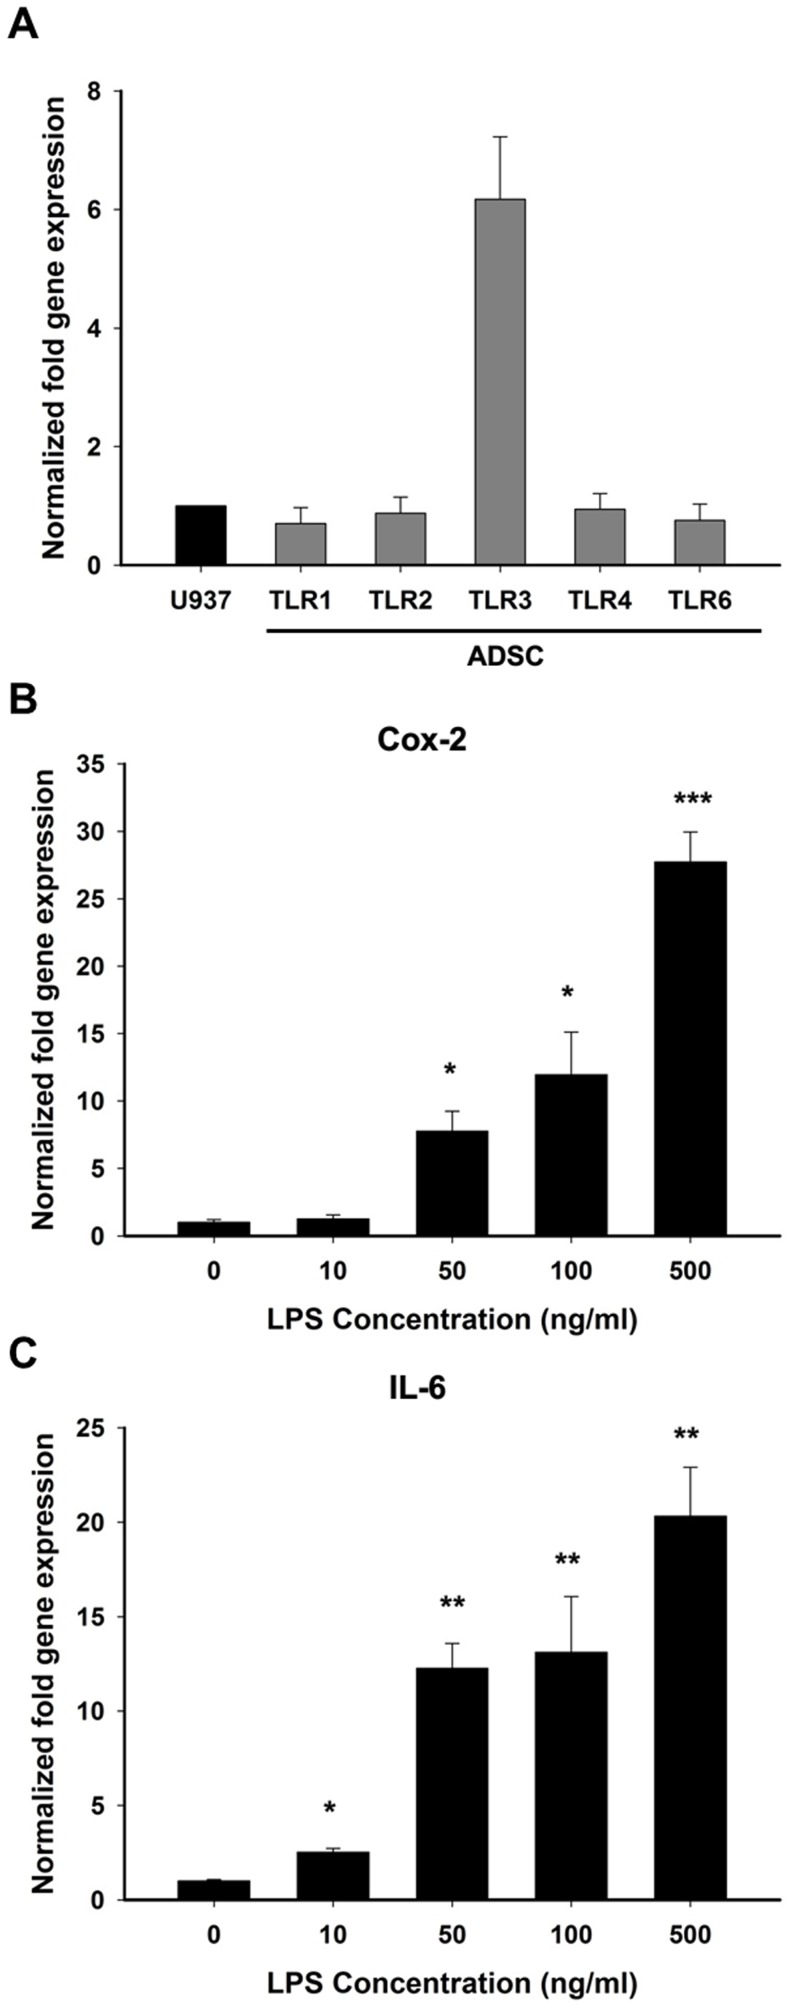
Figure 1. hADSCs expresses TLRs and stimulated by LPS.
(A) The mRNA expression levels of all TLRs in the hADSCs were compared to the expression levels in U937 cells, as determined by real-time RT-PCR analysis; TLR3 showed a higher mRNA expression level in hADSCs than in U937 cells. (B, C) Determination of the optimal LPS treatment concentration by evaluating the expression of Cox-2 and IL-6 mRNA levels. The data are shown as the mean ± SD (n = 3). The following statistical levels were applied: *p<0.05, **p<0.01, and ***p<0.001 compared to the control.

