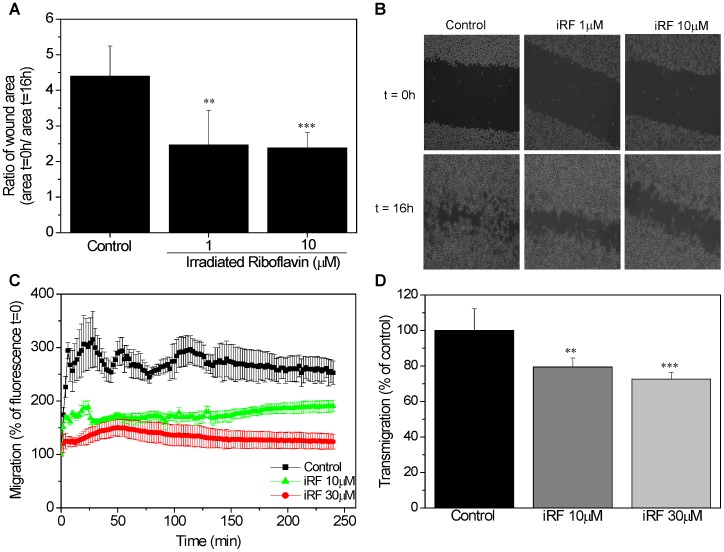
Figure 3. The effect of iRF on melanoma cell migration.
(A) Scratch assay of B16F10 cells exposed to 1 and 10 µM of iRF. The images were acquired at 0 and 16 hours. The ratio of wound area at 16 h and at 0 h represent the inhibition of migration. (B) Representative pictures of scratch assay of each group after 0 and 16 h. (C) B16F10 cells were incubated with CellTracker green and then treated with different concentrations of iRF in serum free DMEM. Fluorescence was measured every 2 min for 4 h. (D) Migration capacity of B16F10 cells through the 2H11 endothelial cells monolayer was analyzed by transmigration assay using Fluoroblock™ inserts at 3 and 18 h. The results represent the means ± SD (n = 9). p<0.05, p<0.01, p<0.001 versus control.

