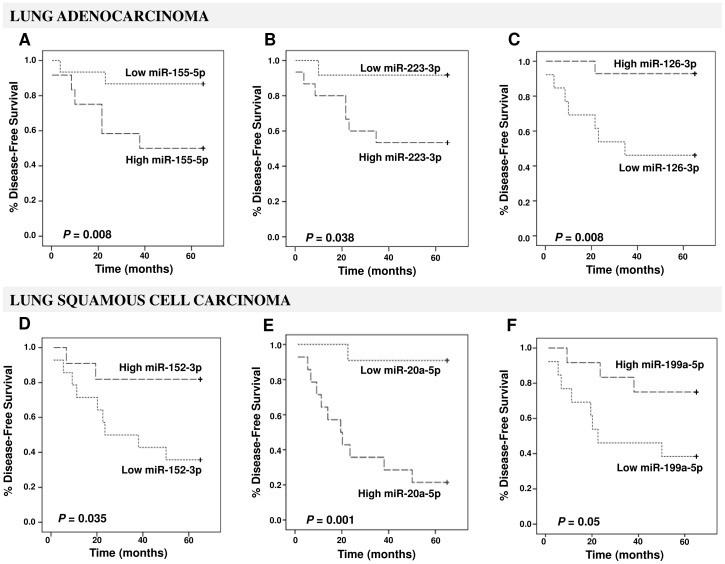
Figure 2. Kaplan-Meier DFS curves for lung adenocarcinoma patients.
(upper panels) and lung squamous cell carcinoma patients (lower panels) stratified according to plasma levels of miR-155-5p (A), miR-223-3p (B), miR-126-3p (C), miR-152-3p (D), miR-20a-5p (E), and miR-199a-5p (F). The P-values were calculated using the log-rank test between patients with high- and low-fold changes.

