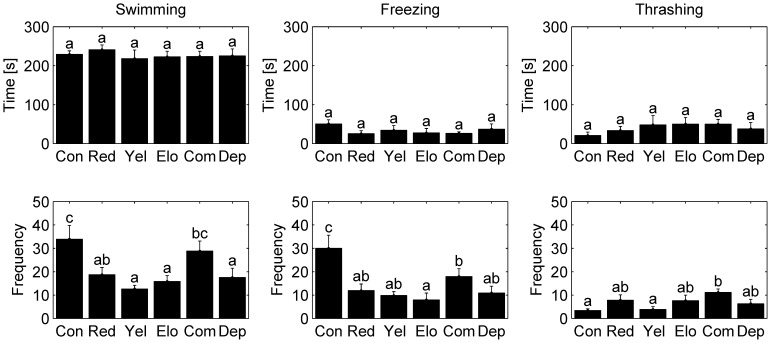
Figure 4. Frequency and duration of fish behaviors.
Histograms of time spent (top) and mean number of events (bottom) by fish swimming, freezing, and thrashing, respectively, in the experimental conditions. Error bars refer to the standard error. Means not sharing a common superscript are significantly different (Fisher's PLSD, p<0.05).

