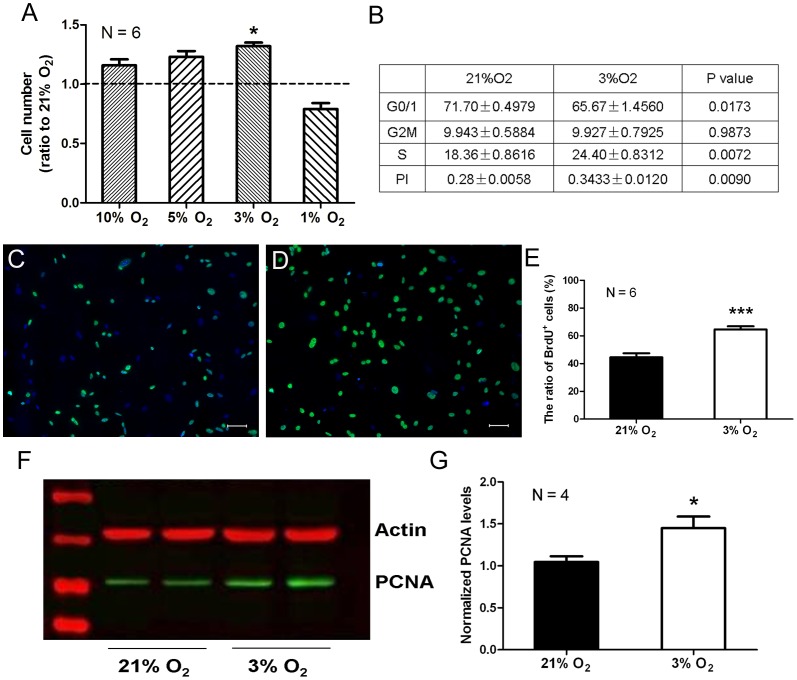
Figure 1. Physiological hypoxia promotes rMSC proliferation.
(A) Cell counting of rMSCs cultured under different oxygen concentration. Cell number is normalized to that of 21% O2 (dashed line). The data are presented as means ± SEM of 6 individual wells. (B) Cell cycle analysis by FACS. The data are presented as a percentage of 3 individual wells. PI (proliferous index) = [(S+G2M) ÷ (G0/1+ S+G2M)] × 100%. (C, D) BrdU incorporation assay for rMSCs cultured under 21% O2 (C) or 3% O2 (D). Scale bar = 50 µm. (E) Quantitative analysis of BrdU incorporation in C and D. The data are presented as means ± SEM of 6 individual wells. (F) Western blot analysis of PCNA expression in rMSCs cultured under 21% O2 and 3% O2, respectively. The graph presented is representative of 4 independent experiments with similar results. (G) Quantitative analysis of PCNA in F. *P<0.05, ***P<0.001.

